本文共 3172 字,大约阅读时间需要 10 分钟。
Metal Tips and Techniques
This chapter discusses tips and techniques that can improve app performance or developer productivity.
Creating Libraries During the App Build Process
Compiling shader language source files and building a library (.metallib file) during the app build process achieves better app performance than compiling shader source code at runtime. You can build a library within Xcode or by using command line utilities.
Using Xcode to Build a Library
Any shader source files that are in your project are automatically used to generate the default library, which you can access from Metal framework code with the method of .
Using Command Line Utilities to Build a Library
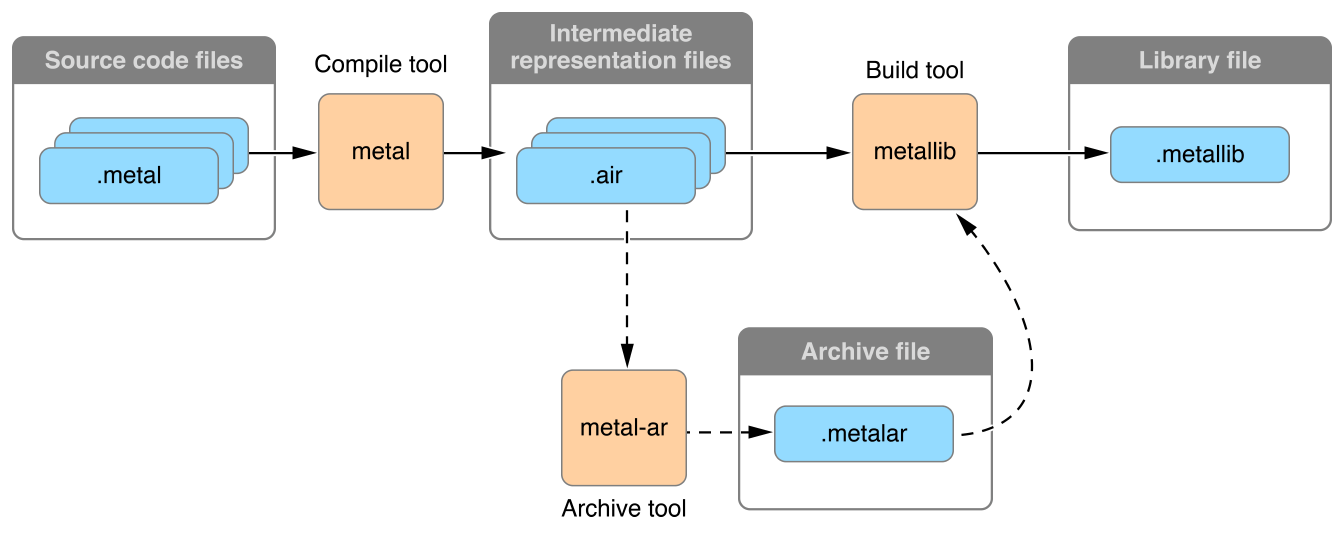
shows the command line utilities that form the compiler toolchain for Metal shader source code. When you include .metal files in your project, Xcode invokes these tools to build a library file that you can access in your app at run time.
To compile shader source into a library without using Xcode:
-
Use
metalto compile each.metalfile into a single.airfile, which stores an intermediate representation of shader language code. -
Use
metal-arto archive several.airfiles together into a single.metalarfile.metal-aris similar to the Unix utilityar. -
Use
metallibto build a Metal.metalliblibrary file from the archive.metalarfile.
To access the resulting library in framework code, call the method of .
Xcode Scheme Settings and Performance
When a Metal app is running from Xcode, the default scheme settings reduce performance. Xcode detects whether the Metal API is used in the source code and automatically enables the GPU Frame Capture and Metal API Validation settings, as seen in Figure 8-2. When GPU Frame Capture is enabled, the debug layer is activated. When Metal API Validation is enabled, each call is validated, which affects performance further. For both settings, CPU performance is more affected than GPU performance. Unless you disable these settings, app performance may noticeably improve when the app is run outside of Xcode.
Figure 8-2 Xcode Scheme Editor Settings for a Metal App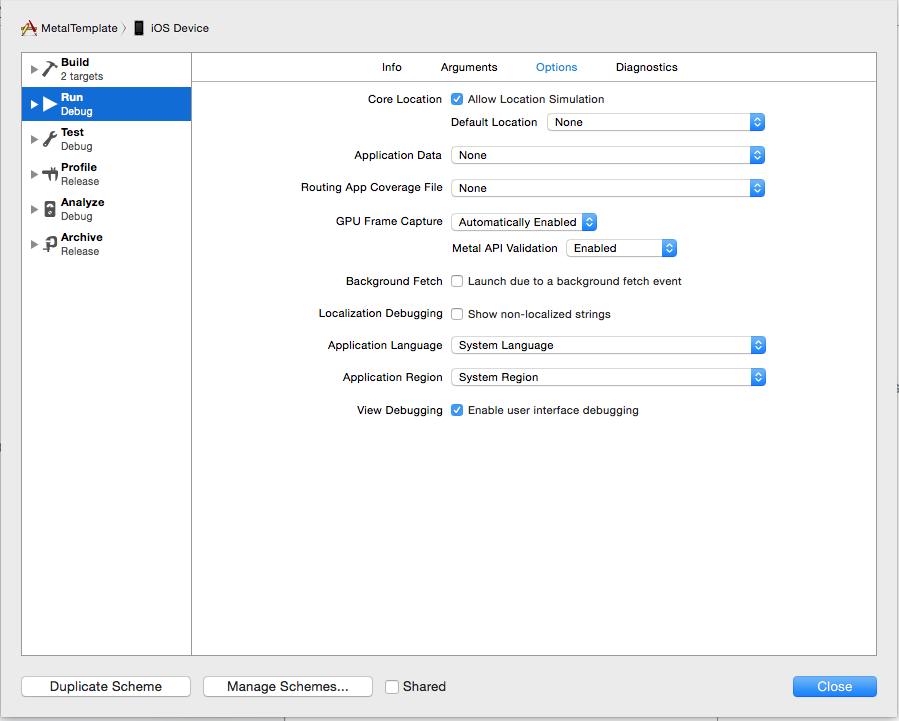
Debugging
Use the tips in the following sections to gain more useful diagnostic information when debugging and profiling your Metal app.
File Extension for Metal Shading Language Source Files
For Metal shading language source code file names, you must use the .metal file name extension to ensure that the development tools (Xcode and the GPU frame debugger) recognize the source files when debugging or profiling.
Performing Frame Capture with Xcode
To perform frame capture in Xcode, enable debug and call the method of to inform Xcode. The and methods of similarly inform Xcode about frame capture, so call only if those methods are not present.
The Label Property
Many Metal framework objects—such as command buffers, pipeline states, and resources—support a property. You can use this property to assign a name for each object that is meaningful in the context of your application’s design. These labels appear in the Xcode Frame Capture debugging interface, allowing you to more easily identify objects.
转载地址:http://azzkn.baihongyu.com/